
The Nvidia Liquidity Vortex
"How I Learned To Stop Worrying And Love The Nvidia Bomb"

Since we presented the Rotation Playbook (“What if?”), the Russell vs Nasdaq ratio is up +20% in the space of a month, one of the best relative performances ever. The Russell vs Nasdaq ratio is now firmly above its 200dma, and the question arises whether this can continue.

Impressively, whereas the Nasdaq was outperforming the Russell by +22% YTD by the end of June when we presented the Playbook, the Nasdaq subsequently dropped by -8% and the Russell rallied by +12%, bringing the 2 indices nearly in line on a YTD % performance!
Just think about it. You could’ve spent the last 7 months riding the much-hyped “AI Trade” and you’d be up +13% on the Nasdaq. Or you could’ve just played the “Rotation Trade” in July and made +20% … in a month.
We give thanks.

As with any solid Investment thesis, it all started with a Meme:
At our piece titled “What if?” we highlighted that in H1 2024, the Market felt like the Liquidity was getting sucked out of it and funnelled into Nvidia:
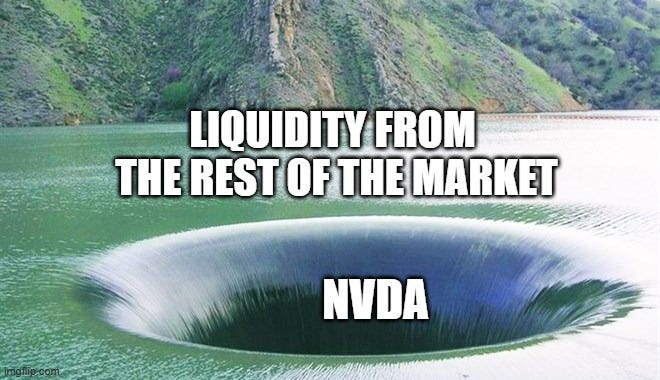
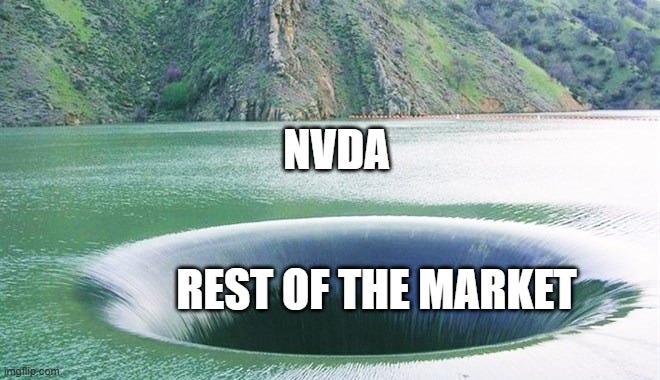
We then asked ourselves “What if?”… someone just turns the taps the other way round… and liquidity flows from Nvidia to the rest of the Market?
Since that piece, we further elaborated on the Rotation playbook using Technicals, Fundamentals and Positioning Data (See “Election Volatility - Part 2”).
In today’s Shrubstack, we come back and focus more on the impact of Liquidity and Flows, as per the original Meme (We have already filed the Meme under “Memes that Make Money” ™).
We dive into the actual flows that drive Nvidia’s share price. We ended up getting into a rabbit hole and what we saw cannot be unseen.
Firstly, lets start with a basic analysis of Passive Flows.
Passive Flows: one and the same
By now, even the last monkey is aware that the Market is highly concentrated into a handful of stocks:
The top 7 stocks that overlap between the S&P and the Nasdaq account for 32% of the S&P Market Cap and 45% of the Nasdaq Market Cap
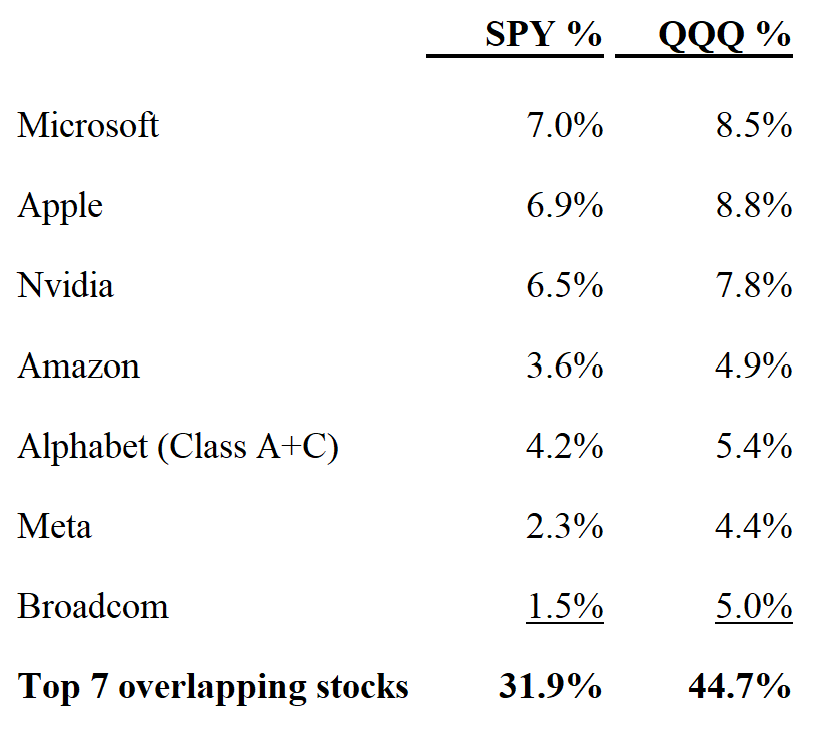
What is commonly not appreciated is the impact of passive flows for these stocks. The better way of thinking about it is as such (h/t Scott Rubner of Goldman Sachs for the idea):
For every $100 of passive money allocated to the S&P, $32 ends up in these 7 stocks
For every $100 of passive money allocated to the Nasdaq, $45 ends up in these same 7 stocks
Therefore, it’s not only the high concentration that matters, it’s also this extreme overlap between the 2 major Indices!

Which brings us to Nvidia…
Nvidia Flows
Now we get to have some fun.