Season(ality) Greetings
Just a few random charts on seasonality
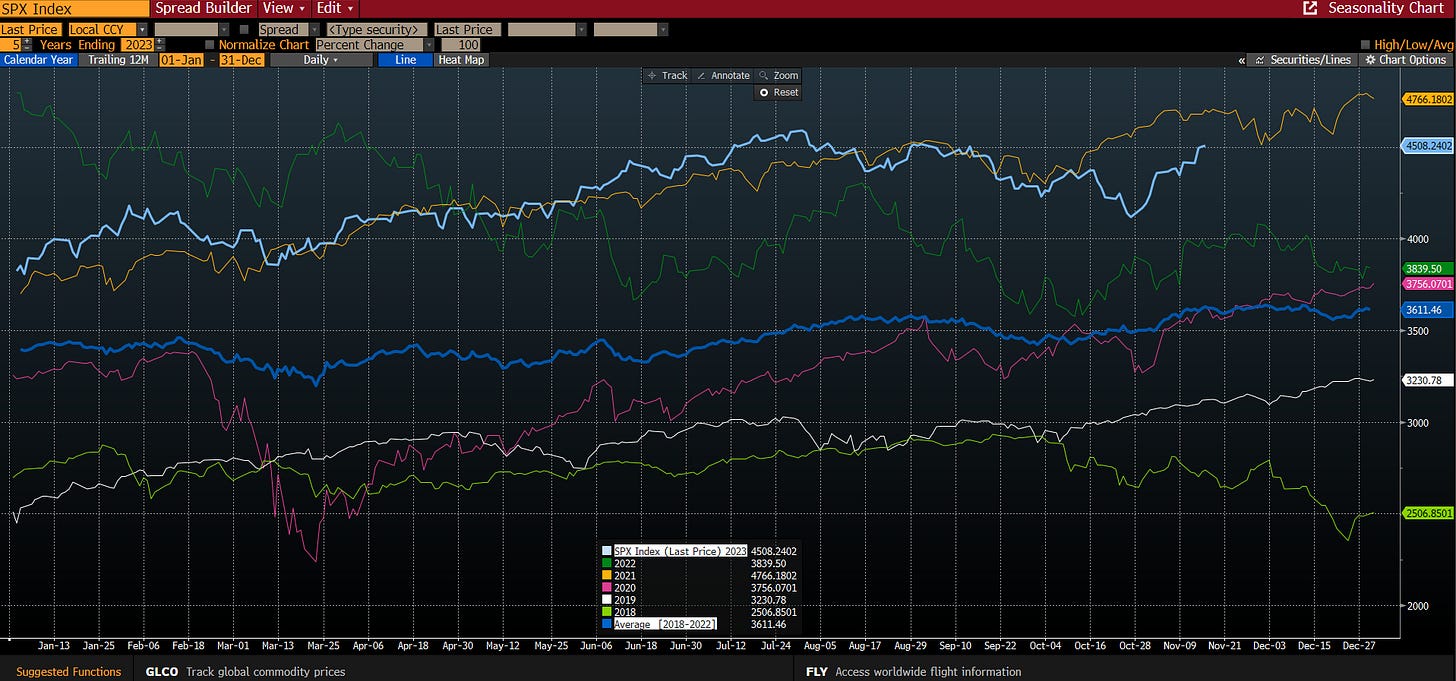
I thought I’d share a few seasonality charts that caught my attention as I’m spending time to think around the theme of the “One Last Yolo” (see previous post). In the charts below, I highlight the current trajectory and the average from 2018-22.
Oil
Seasonally, Oil peaks around October and bottoms around 1st week of December. So far, it’s following the average path.
S&P 500
The S&P usually peaks around now, before a mini-dip (into Thanksgiving?) and then recovers by year-end.
Dollar
Mamma-mia, this is a pretty clear trend: The dollar usually sells off into year-end
TLT
I just used this one as a proxy for bonds generally and for a bit of fun (TLT is the ETF for 20+ year duration bonds). In this case, it’s quite interesting to look at the 2022 precedent and the average as well. Seems that bonds peak / yields bottom around 1st week of December. For those with the memory of a goldfish, please refer to the Crude seasonality chart and note that Oil bottoms in the 1st week of December.
Maybe the algos have already pre-empted these trades. Maybe the algos will push these trends even further. Maybe the algos are just an expression of our own stupidity and they have no clue what they are doing either.
So make of these charts what you will!


Great take, thank you Shrub!
TLT wise: 2 years, 7 (believed) FED pivots ... Is this latest one 'The One’ ? :) Food for thought … can’t post the chart here, hence link:
https://twitter.com/Maverick_Equity/status/1725096412583444635
Thank u Shrub for sharing - pet rock on fire